How to debug like a pro using Xdebug, PHPStorm, and Docker.
Building an application as a developer can be fun sometimes. It can also be a pain especially when you encounter a bug, and you couldn’t locate where the bug is being introduced.
Developers often make use of var_dump() and dd() to view what value is passed to the function and why the value is not returning the right result. This can be time-consuming and inefficient as you have to keep refreshing your browser to see the results.
In this article, I’m going to show you how to configure Xdebug with PHPStorm and Docker to debug like a pro.
What is XDebug?
Xdebug is an extension for PHP and provides a range of features to improve the PHP development experience.
Step Debugging
A way to step through your code in your IDE or editor while the script is executing.
Improvements to PHP’s error reporting
An improved var_dump() function, stack traces for Notices, Warnings, Errors, and Exceptions to highlight the code path to the error
Tracing
Writes every function call, with arguments and invocation location to disk. Optionally also includes every variable assignment and return value for each function.
Profiling
Allows you, with the help of visualization tools, to analyze the performance of your PHP application and find bottlenecks.
Code Coverage Analysis
To show which parts of your codebase are executed when running unit tests with PHP Unit.
Install and Configure Xdebug
In a dockerized app, you need to install Xdebug and configure the debugger in your Dockerfile like below;
pecl install xdebug; \
docker-php-ext-enable xdebug; \
echo "error_reporting = E_ALL" >> /usr/local/etc/php/conf.d/docker-php-ext-xdebug.ini; \
echo "display_startup_errors = On" >> /usr/local/etc/php/conf.d/docker-php-ext-xdebug.ini; \
echo "display_errors = On" >> /usr/local/etc/php/conf.d/docker-php-ext-xdebug.ini; \
echo "xdebug.remote_enable=1" >> /usr/local/etc/php/conf.d/docker-php-ext-xdebug.ini; \
echo "xdebug.mode=develop,trace,debug" >> /usr/local/etc/php/conf.d/docker-php-ext-xdebug.ini; \
echo "xdebug.start_with_request = yes" >> /usr/local/etc/php/conf.d/docker-php-ext-xdebug.ini; \
echo "xdebug.discover_client_host=1" >> /usr/local/etc/php/conf.d/docker-php-ext-xdebug.ini; \
echo "xdebug.client_host=host.docker.internal" >> /usr/local/etc/php/conf.d/docker-php-ext-xdebug.ini; \
echo "xdebug.client_port=9003" >> /usr/local/etc/php/conf.d/docker-php-ext-xdebug.ini; \
echo "zend_extension=/usr/local/lib/php/extensions/no-debug-non-zts-20200930/xdebug.so" >> /usr/local/etc/php/conf.d/docker-php-ext-xdebug.ini; \
echo "xdebug.idekey=PHPSTORM" >> /usr/local/etc/php/conf.d/docker-php-ext-xdebug.ini; \
When you run docker compose up -d Xdebug will be installed and the Xdebug configuration would be exported to the php.ini You can check if Xdebug has been set up for you.
Run docker ps to view the container name and docker exec -it container-name /bin/bash or docker exec -it container-name /bin/sh if you are using the alpine image.
In your container, type php --version and you should see the PHP version and the Xdebug version like below;
PHP 8.0.3 (cli) (built: Apr 10 2021 13:25:28) ( NTS )
Copyright © The PHP Group
Zend Engine v4.0.3, Copyright © Zend Technologies
with Xdebug v3.1.1, Copyright © 2002–2021, by Derick Rethans
The next step is to configure PHPStorm.
Setup a server in PHPStorm
- Click on the PHPStorm icon and select preference.
- Click on PHP then click on the server
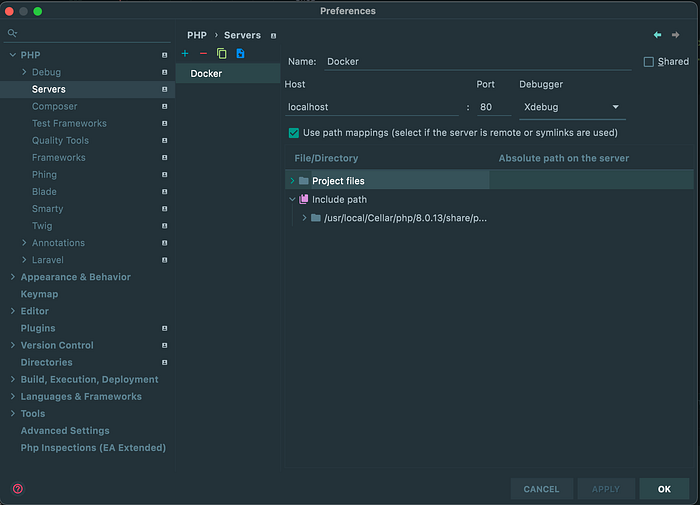
- Name your server
- Type localhost as Host
- Select Xdebug
- Check path mapping
- Click ok
Configure Xdebug
- Click on the PHPStorm icon and select preference.
- Click on Debug and configure Xdebug
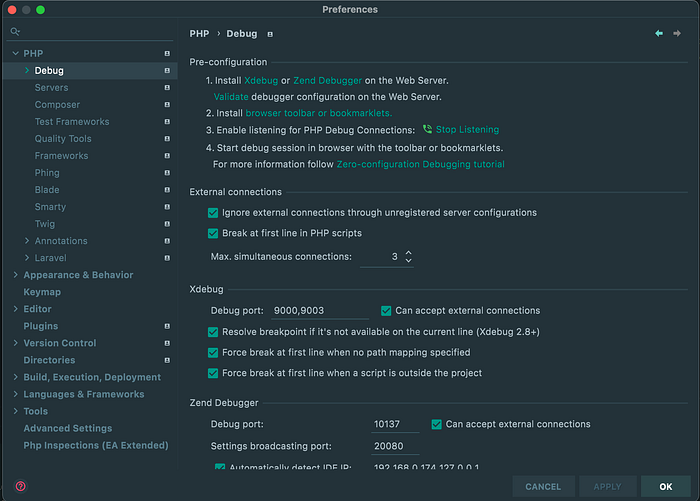
- Select all the options under Xdebug
Install Browser debugging extensions
Next is to set up browser listeners for the Xdebug. There are a couple of plugins that can help you trigger a session when Docker sends a signal to PHPStorm.
You can install anyone for your preferred browser here and follow the instructions.
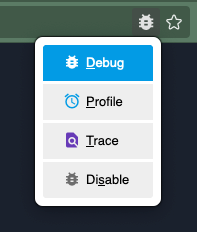
Start Listening

Once you have completed the above steps, then click on the call icon, it should turn green. Now you can go to your browser and click on the debug extension browser icon and select Debug.
Place a step on any line in your editor and refresh your browser. And you should receive a request in your PHPStorm editor as shown below;
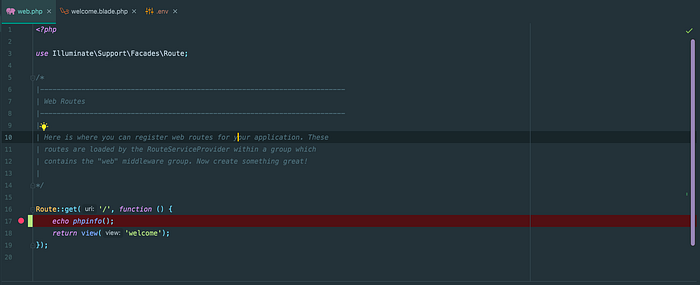
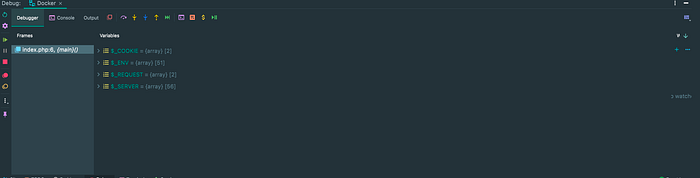
The next thing is to start using the debugger tab to debug your code.
If you would like to learn how to use the debugging functions such as a step into, step to next, etc in PHPStorm, you can follow this short tutorial on LaraCast.
Thanks for taking the time to read this article. I hope this helps someone to debug faster.
Feel free to drop a comment if you have any feedback.